Web Dashboard
Bi Dashboards
Capture and analyze business data easily with Repzo BI Dashboards. Whether you are part of a marketing team.
Create your first dashboard
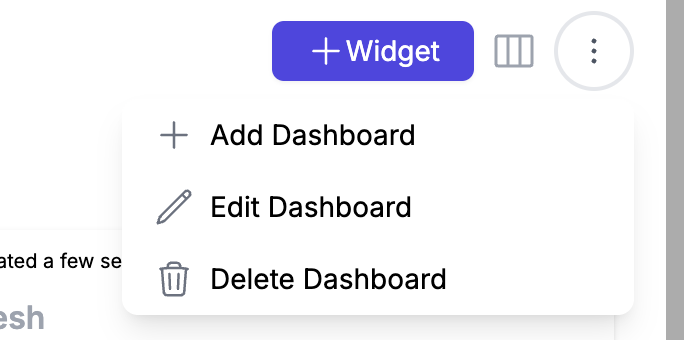
- Choose a name for your dashboard
- Local name could be arabic name for example
- Selecting a team means this dashboard will be visible only for that team
- Enabling 'Rep can view dashboard' will allow your rep to view this dashboard in the mobile device , but only his own data will be displayed.
Add your first widget
Click on widget button
Repzo provides a library of widgets for each module, choose one to configure it.
Available fields
- Name of your widget
- Local name for example arabic name
- Time period of widget Current / Last (example if you want to get widget metrics for current month choose Current)
- Widget cycle Day/Week/Month/Quarter/Year
- Limit field will get only limited number of results as specified
- Share activities with team mates checkbox allow your reps if they are in the same team to see each other's results.
Filters(optional) List of available filters to narrow down your results for each widget . for example you can choose specific client channel for this widget
Widget Types
- NumberBox : Displays a single numerical value, ideal for showcasing key metrics like total sales or revenue.
- Stack List : Presents a vertical list of items or values, useful for ranked data like top clients or products.
- Table : Shows data in a structured grid format, perfect for viewing detailed information across multiple fields.
- Line chart :Visualizes trends over time with lines connecting data points, useful for showing progress or comparisons over days, weeks, or months.
- Pie chart : Displays data as a circle divided into slices, each representing a portion of the whole, ideal for percentage-based data.
- Bar Chart : Uses horizontal or vertical bars to compare values across different categories, great for comparing sales or performance metrics.
- Stacked Bar Chart : Similar to a bar chart but with segments stacked on top of each other, useful for visualizing the breakdown of a total across categories.
- Leader board Points : Displays a ranked list based on point values, useful for competition or performance tracking.
- Leader board achievements : Ranks users or teams based on achievements or goals, showcasing top performers.
- Map : geographic data, useful for tracking location-based metrics such as sales territories or client distribution
Edit your layout
Click on edit layout button to rearrange and resize your widgets to make your dashboard clean and organized.
Global Filters
Sometimes you may want to apply filters across all your widgets. The global filter feature makes this possible. Click on the 'Global Filters' button, select your filters, and the data will be filtered only for widgets where the filters are applicable.